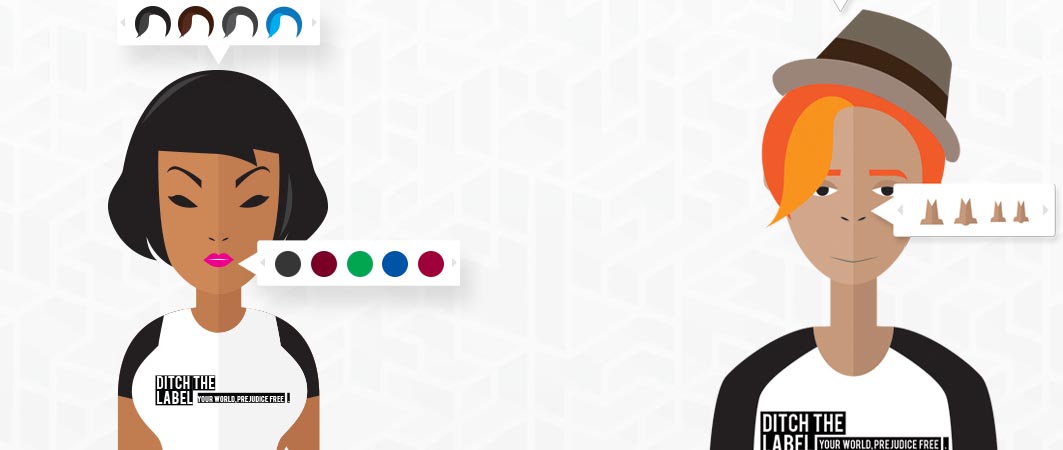
As part of The Annual Bullying Survey 2015, we asked young people how they felt about their appearance. We found that 1 in 2 young people would alter how they looked in order to feel better about themselves. Check out our interactive infograph belows to find out how the response varies between different demographics. In this series, we look at variation based on: gender, sexuality, disability, ethnicity, religion and household income.
If you don’t feel particularly great about how you look, check out our Feeling Beautiful Guide.
Gender Variation
Sexuality Variation
Disability Variation
Ethnicity Variation
Religion Variation
Household Income Variation
These infographics were kindly and lovingly produced by our friends at Intel Mcafee as part of their Brighton charity day in 2015. Thank you!


